
92% Win Rate, Almost No Profit — Why a High Win Rate Is a Dangerous Illusion
💡 Reading time: ~10 minutes | Series: Strategy Advanced #2 🎯 Core idea: Don’t be fooled by win rate. What matters in options trading isn’t how often you win, but how big your losses are when you lose.
The numbers don’t lie
| Metric | Value |
|---|---|
| Total trades | 13 |
| Winning trades | 12 |
| Losing trades | 1 (ignoring GOOG $385’s $3 loss) |
| Win rate | 92.3% |
| Total gains | +$17,752 |
| Total losses | -$16,530 |
| Net profit | +$1,219 |
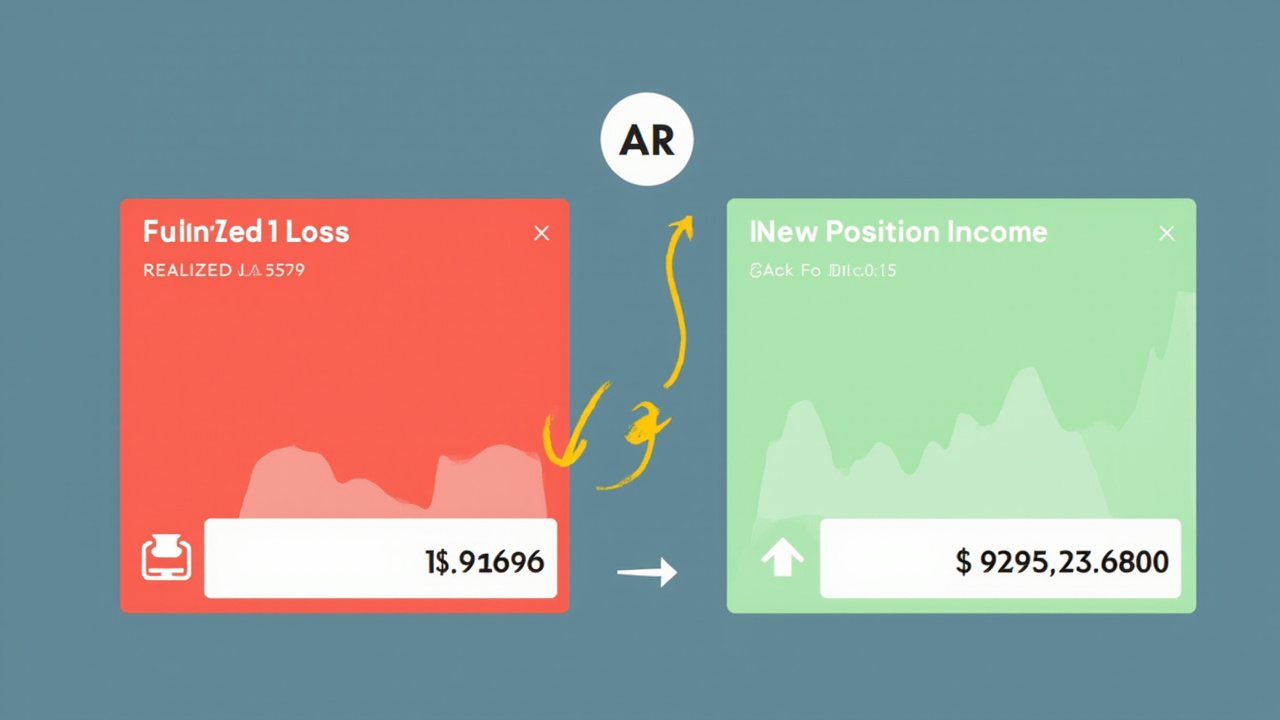
92% win rate. Sounds like a trading god.
But net profit is just $1,219 — over half a year, that’s $203/month. Not enough to cover a decent dinner out.
12 winning trades’ gains almost got wiped out by 1 losing trade.
Sell Put’s structural issue: many small wins, one big loss
This isn’t my personal problem — it’s the natural structure of the Sell Put strategy:
Typical winning trade: +$500 to +$2,500 (collecting rent, steady)
Typical losing trade: -$5,000 to -$15,000 (stock craters, one shot)
It’s like an insurance company — happily collecting premiums every month, and one hurricane blows away the year’s profits.
Expected value calculation
Whether a trading system is viable doesn’t depend on win rate, but on expected value.
Expected value = (win rate × average win) - (loss rate × average loss)
My real data:
Win rate: 92.3%
Loss rate: 7.7% (strictly speaking, two roll-outs)
Average win: $17,752 ÷ 12 = $1,479
Average loss: $16,530 ÷ 1 = $16,530

Expected value = (92.3% × $1,479) - (7.7% × $16,530)
             = $1,365 - $1,273
             = +$92 / trade
The expected value per trade is only $92.
That means my system “barely makes money” — and the safety margin is paper-thin. If those two roll-out losses had been just $1,000 bigger each, I’d be in negative expected value.
Where’s the problem? Not the low win rate, but the huge loss
| Issue | Value | Severity |
|---|---|---|
| Win rate | 92.3% | ✅ Good |
| Average win | $1,479 | ✅ Acceptable |
| Average loss | $16,530 | 🔴 Fatal |
| Win/loss ratio | 1:11 | 🔴 Extremely imbalanced |
For every $1 I win, I expose myself to $11 of risk. That’s terrifying.
What should the ideal data structure look like?
| Metric | Current | Target | Improvement direction |
|---|---|---|---|
| Win rate | 92.3% | 80%+ | OK to lower somewhat |
| Average win | $1,479 | $1,500+ | Maintain |
| Average loss | $16,530 | ≤ $3,000 | 🎯 Key improvement |
| Win/loss ratio | 1:11 | 1:2 | 🎯 Must improve |
| Expected value/trade | $92 | $900+ | Naturally rises |
Note: win rate can drop from 92% to 80% (no need to chase perfection). But the average loss must compress from $16,530 to under $3,000.
Simulating the target data:
Expected value = (80% × $1,500) - (20% × $3,000)
             = $1,200 - $600
             = +$600 / trade
$600 expected per trade — 6.5× the current $92. And this is a more robust system — even with two or three consecutive losses, it won’t break the bones.
How to compress the average loss to below $3,000?
This is the core of Part 2 (“Iron-clad risk-management rules”). But let me reorganize it from a win-rate perspective:
Method 1: strict stop-losses
Stop the day the line breaks 2%. No mercy.
Take NVDA $223: if I’d stopped at the -2% line break, the loss would have been around $2,220 (vs actual $6,060).
Method 2: position size control
Single-trade margin ≤ 20% of total capital.
6 contracts → 3 contracts. Even if the stop is late, the loss is only half.
Method 3: safety buffer ≥ 8%
Strike at least 8% below the stock. This brings the probability of “line break” down to under 15%, and the loss is smaller when it does.
Method 4: don’t chase win rate, accept “small losses”
Many Sell Put beginners (including past me) have the mindset: “I can’t lose, losing means the strategy is wrong.”
Wrong. Loss is part of the system. You don’t need a 92% win rate. 80% is enough — as long as every loss is capped at $3,000.
A $2,000 small loss is a hundred times better than a $16,000 big loss, even though the former “looks like a loss.”
The true mindset of a Sell Put seller
| Beginner mindset | Correct mindset |
|---|---|
| “I need to win every trade” | “I accept 20% losses, but every loss is < $3,000” |
| “The higher the win rate, the better” | “The higher the expected value, the better” |
| “Loss is failure” | “Small losses are the normal cost of running the system” |
| “This time it will definitely bounce” | “I don’t know if it will bounce, but I know where my stop is” |
📌 Little Otter’s lesson: 92% win rate, $1,219 net profit — this number pair is my report card for the half-year. It tells me one thing: win rate is the easiest metric to get drunk on, and the easiest to make you ignore risk. From today on, I don’t chase win rate. I chase: every loss ≤ $3,000.
Disclaimer: This article is a personal trading experience share, not investment advice.
Comments